IPL DATA ANALYSIS (2008 - 2019)

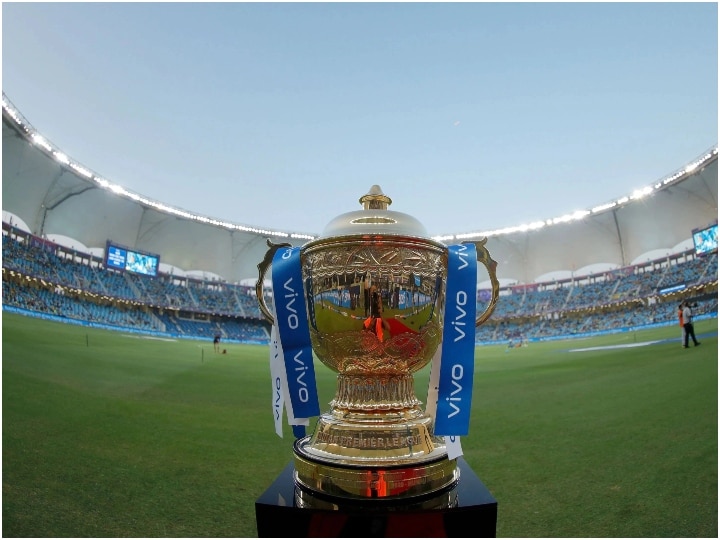
Indian Premier League more popularly called IPL is a Cricket Tournament hoisted by the Cricket Board of India(BCCI). Players from different countries participate in IPL making it an exciting opportunity to entertain cricket lovers. IPL was established in 2008 when the first season of IPL was hoisted. Since then every year the IPL game is played and celebrated as a month-long cricket festival for Indians and cricket lovers throughout the world. IPL also gives opportunities to the young players to showcase their talent and improve their experience by playing with some of the best and most experienced players of cricket. As the current season of IPL(2020) is ongoing let us all revise and analyze the performance of players in the previous Seasons.
In this project, I am going to go through two datasets of IPL matches in INDIA, observe the data, analyze and process it and going to answer a few common questions about the dataset that would generally bug you. Go through the notebook carefully and enjoy the different observations made by me.
About the Datasets.
The given dataset was taken from the dataset bundle present in Kaggle Datasets, Refer to this link IPL 2008-2019 Kaggle Dataset to get more information about the dataset and download it from Kaggle to work with it.
With this dataset I am trying to visualize different trends in the IPL score of teams and players from 2008 to 2019, As the current season of IPL 2020 is ongoing it would be fun and helpful to know the stats of teams and players visually for the last 11 years. Hope you will enjoy the visualization provided by me.
The name of the Dataset used for this project are matches.csv and deliveries.csv. There are 756 rows in the matches.csv file each row containing data about a specific match. The deliveries.csv dataset is a huge one with over 1.79 Lakhs of rows of data and every row represents data from each delivery from each match for the last 11 years.
I will be using Python 3 for this analysis, And am doing this project in Jupyter Notebook(Kaggle and Google Collab are also good options to run this notebook and work with it). The Libraries/Packages I will be using in this project are as followed.
- jovian (to upload, save and share the contents of my notebook)
- numpy (as np is one of the very famous packages for working with arrays in python)
- pandas (Is greatly used in the analysis of data and making dataframe)
- matplotlib (Let's make our Analyzation fun and interactive with the visualization library matplotlib)
- seaborn (Adding more colors into matplotlib visualization)
- collections (specialized container datatypes providing alternatives to Python's general-purpose built-in containers like dict, list, etc.)
- opendatasets (A great library to fetch data from Kaggle or from its own content)
If you want to run this notebook on your machine the steps to do so are given at the end of the Project.
Table of Contents
-
Importing Packages
-
Fetching the dataset
-
Data Preparation and Cleaning
- Data Preparation in the matches dataframe
- Data Preparation for Deliveries dataframe
- Creating a Data Frame having total runs per team per innings.
- Creating a Data Frame of Batsman with their respective strike rates, avg run rate etc.
-
Exploratory Analysis and Visualization
-
Batting
- Top 10 players with highest average runs.
- Top 10 players with highest strike rates.
- Top 10 players on the basis of runs scored till IPL 2019.
-
Bowling
- Most balls bowled per season/Year.
- Top 10 highest wicket Taker of all time.
-
Umpire
- Most used on-field umpire Per Season.
-
Team Management
- Top 10 most used Stadium.
- No. of times each team has won an IPL Season.
-
-
Asking and Answering Questions
- Does Winning the toss play a role in winning the match?
- What are the most common types of dismissals?
- Which team has won most matches of IPL till now?
- Do the teams with the highest win counts also tops in the chart of highest win percentage?
- Does Batting first/Fielding first helps a team to win when DL is applied?
- Which Stadiums are suited for batting, balling, or has a neutral pitch?
- Does give more extra runs effects in the result of the game?
- Who won the orange Cap Award and Purple Cap Award each Year?
- Who are the top 5 Umpires to look over matches in IPL?
-
Inferences and Conclusion
-
Reference and Future Works
-
Steps to run the Notebook
project_name = "IPL-data-analysis"